Introduction In today's fast-paced software development world, continuous integration and continuous deployment (CI/CD) are essential for fast and reliable software delivery. This guide explains how to deploy a Java Full Stack Application into a Kubernetes cluster using a Jenkins CI/CD pipeline. It covers the entire process, from the initial client request to the final deployment.
Ticket Description: A client submits a ticket requesting a specific change, such as adjusting the background color.
The goal is to deploy the Java Full Stack Application to our Kubernetes cluster using a Jenkins CI/CD pipeline. The deployment process will include steps like compiling, testing, code quality checks, storing artifacts, creating a Docker image, scanning for vulnerabilities, and finally deploying to Kubernetes.
Here’s a more polished and professional rewrite of the workflow:
Workflow Followed in Companies
Phase I: Infrastructure Setup
Create a Virtual Machine (VM)
Begin by setting up our VM environment.Isolate the Network
Ensure the network is private, isolated, and secure by configuring a Virtual Private Cloud (VPC) and Security Groups.Kubernetes Cluster Setup and Security
Set up the Kubernetes (K8s) cluster and perform a vulnerability scan to ensure security.Server Setup for Essential Tools
Set up servers for SonarQube (code quality analysis) and Nexus (artifact repository).
Install tools such as Jenkins for CI/CD automation and Prometheus and Grafana for system and application monitoring.
Phase II: Code Management
- Create a Private Git Repository
Initialize a private Git repository and push the source code for version control and collaboration.
Phase III: CI/CD Pipeline Setup
Continuous Integration (CI) Pipeline
Ensure adherence to best practices during the CI process, focusing on code quality and efficiency.
Implement security measures throughout the pipeline to protect the application.
Continuous Deployment (CD) Pipeline
Automate the deployment process for the application using a secure and efficient CD pipeline.
Configure mail notifications for pipeline status and deployment updates.
Phase IV: Monitoring Setup
System-Level Monitoring with Prometheus
Monitor system metrics such as CPU usage, memory (RAM), and disk I/O using Prometheus.Application/Website-Level Monitoring with Grafana
Use Grafana to track application-level metrics such as website traffic, latency, and response times.
Project Steps
Phase I: Environment Setup
1a. Setting Up the Private Environment (VPC)
We will use the default VPC for this project to isolate our environment and ensure it is private.
1b. Creating Security Groups
Configure security groups to manage inbound and outbound traffic.

Below are the specific port ranges we will open:
3000–32767: Used for application deployment.
465: Used to send notifications to our Gmail account.
6443: Used for setting up the Kubernetes (K8s) cluster.
22: Used for SSH access.
443: Secure port for HTTPS traffic.
80: Unsecured port for HTTP traffic.
3000–10000: Additional range for future use, as needed.
25: Used for sending emails via SMTP.
2. Setting Up the Kubernetes (K8s) Cluster and Vulnerability Scanning
Step 1: Launch Instances
Create three virtual machines (VMs):
1 Master Node (2cpu, 8gb ram)
2 Worker Nodes
Steps:
1. Creating Three Ubuntu 24.04 VM Instances on AWS
Step 1: Sign in to the AWS Management Console
Go to the AWS Management Console.
Sign in using your AWS account credentials.
Step 2: Navigate to EC2
- In the AWS Console, type EC2 in the search bar or select Services > EC2 under the Compute section.
Step 3: Launch an Instance
In the EC2 Dashboard sidebar, click on Instances.
Select Launch Instance.
Step 4: Choose an Amazon Machine Image (AMI)
From the available list of AMIs, select Ubuntu Server 24.04 LTS.
Click Select.
Step 5: Choose an Instance Type
Choose an instance type based on your requirements (e.g., t2.micro for testing).
Click Next: Configure Instance Details.
Step 6: Configure Instance Details
Adjust any instance details as needed or leave the default settings.
Click Next: Add Storage.
Step 7: Add Storage
Specify the desired root volume size (default settings are usually adequate).
Click Next: Add Tags.
Step 8: Add Tags
Optionally, add tags to organize your instances.
Click Next: Configure Security Group.
Step 9: Configure Security Group or use the existing one created in the above
Set up a security group to allow SSH access (port 22) from your IP address.
Optionally, enable other ports like HTTP (port 80) or HTTPS (port 443) as required.
Click Review and Launch.
Step 10: Review and Launch
Review the instance details to ensure everything is correctly configured.
Click Launch.
Step 11: Select a Key Pair
Choose an existing key pair or create a new one for secure access.
Acknowledge that you have access to the key pair.
Click Launch Instances.
Step 12: Access Your Instances
Use an SSH client, such as MobaXterm, to connect to your instances:
Open MobaXterm and click Session > SSH.
Enter the public IP address of the instance.
Select Specify username and enter ubuntu as the username.
Under Advanced SSH settings, select Use private key and browse for your .pem file.
Click OK to establish the connection.
Run the following commands on all servers (Master and Worker nodes):
        sudo -i
        sudo apt update
Create and Configure the K8s Cluster Script
Create a script to automate the installation process: vim doc_k8s.sh
Add the following content to the script:
 #!/bin/bash

 # Update package lists
 sudo apt update

 # Install Docker
 sudo apt install docker.io -y

 # Set Docker to launch on boot
 sudo systemctl enable docker

 # Verify Docker is running
 sudo systemctl status docker

 # If Docker is not running, start it
 sudo systemctl start docker

 # Install Kubernetes
 # Add Kubernetes repository key
 curl -fsSL https://pkgs.k8s.io/core:/stable:/v1.30/deb/Release.key | sudo gpg --dearmor -o /etc/apt/keyrings/kubernetes-apt-keyring.gpg

 # Add Kubernetes repository
 echo 'deb [signed-by=/etc/apt/keyrings/kubernetes-apt-keyring.gpg] https://pkgs.k8s.io/core:/stable:/v1.30/deb/ /' | sudo tee /etc/apt/sources.list.d/kubernetes.list

 # Update package lists again
 sudo apt update

 # Install specific versions of kubeadm, kubectl, and kubelet
 sudo apt install kubeadm kubelet kubectl -y

 # Hold the Kubernetes packages at the current version
 sudo apt-mark hold kubeadm kubectl kubelet
Save the script, make it executable, and run it:
 chmod +x doc_k8t.sh
 sudo ./doc_k8t.sh
Initialize the Kubernetes Cluster on the Master Node:
On the Master Node only, run the following command to initialize the Kubernetes cluster:
sudo kubeadm init --pod-network-cidr=10.244.0.0/16This command will generate a token. Copy the token as it will be used to connect the Worker nodes to the cluster.
Configure Kubeconfig on the Master Node
Run the following commands to create the kubeconfig file for cluster management:
        mkdir -p $HOME/.kube
        sudo cp -i /etc/kubernetes/admin.conf $HOME/.kube/config
        sudo chown $(id -u):$(id -g) $HOME/.kube/configApply Network Plugins
Apply Network Plugins
Install the required network plugins for the cluster:
        kubectl apply -f https://docs.projectcalico.org/v3.20/manifests/calico.yaml
        kubectl apply -f https://raw.githubusercontent.com/kubernetes/ingress-nginx/controller-v0.49.0/deploy/static/provider/baremetal/deploy.yaml
Check the Cluster Status
On the Master Node, verify the nodes are active:
kubectl get nodesConnecting Worker Nodes
- Use the token generated in Step 5 to join the Worker Nodes to the Master Node by running the token command on each Worker Node.
Scan the K8s Cluster for Vulnerabilities
- Download and extract KubeAudit to scan the Kubernetes cluster:
    wget https://github.com/Shopify/kubeaudit/releases/download/v0.22.1/kubeaudit_0.22.1_linux_amd64.tar.gz
    tar -xvzf kubeaudit_0.22.1_linux_amd64.tar.gz
    sudo mv kubeaudit /usr/local/bin/
Run the vulnerability scan: kubeaudit all
- This command will display the current state of your Kubernetes cluster. You may see some errors since no applications have been deployed to the cluster yet, but this is expected.
3. Setting Up SonarQube and Nexus Servers
Step 1: SSH into Both Servers
Connect to both SonarQube and Nexus servers via SSH or use Mobaxtreame and maintain a separate section :
 ssh user@<sonarqube-server-ip>
 ssh user@<nexus-server-ip>
Switch to superuser and update the system packages:
 sudo su
 sudo apt update
Step 2: Install Docker on SonarQube and Nexus Servers
Create a script to install Docker on both SonarQube and Nexus servers:
vim doc.shAdd the following content to the
doc.shscript:#!/bin/bash # Install dependencies sudo apt-get update sudo apt-get install ca-certificates curl -y # Add Docker's GPG key sudo install -m 0755 -d /etc/apt/keyrings sudo curl -fsSL https://download.docker.com/linux/ubuntu/gpg -o /etc/apt/keyrings/docker.asc sudo chmod a+r /etc/apt/keyrings/docker.asc # Add Docker repository echo \ "deb [arch=$(dpkg --print-architecture) signed-by=/etc/apt/keyrings/docker.asc] https://download.docker.com/linux/ubuntu \ $(. /etc/os-release && echo "$VERSION_CODENAME") stable" | \ sudo tee /etc/apt/sources.list.d/docker.list > /dev/null # Install Docker sudo apt-get update sudo apt-get install docker-ce docker-ce-cli containerd.io docker-buildx-plugin docker-compose-plugin -ySave the script, make it executable, and run it:
 chmod +x doc.sh
 sudo ./doc.sh
Adjust Docker socket permissions:
sudo chmod 666 /var/run/docker.sockVerify Docker installation by running a test container:
 docker pull hello-world
 docker run hello-world
Step 4: Create Docker Containers for SonarQube and Nexus
SonarQube:
docker run -d --name sonar -p 9000:9000 sonarqube:lts-communityNexus:
docker run -d --name nexus -p 8081:8081 sonatype/nexus3
Step 5: Access SonarQube and Nexus
SonarQube:
Open your browser and go to:
http://<sonarqube-server-ip>:9000Login using:
Username:
adminPassword:
admin
You will be prompted to change the password.
Nexus:
Open your browser and go to:
http://<nexus-server-ip>:8081Retrieve the Nexus admin password:
Get the container ID:
docker psAccess the Nexus container:
docker exec -it <container-id> bashNavigate and retrieve the admin password:
 cd /nexus-data/admin.password
 cat admin.password
Copy the token, then go back to the browser.
Login using:
Username:
adminPassword: token from above.
You will be prompted to change the password and complete the setup.
5.Step-by-Step Jenkins Setup
Step 1: SSH into Jenkins Server
Connect to your Jenkins server via SSH:
ssh user@<jenkins-server-ip>Switch to superuser and update the system:
 sudo su
 sudo apt update
Step 2: Create Jenkins Setup Script
Create a shell script for installing Jenkins:
vim jenkins.shAdd the following content to the script:
 #!/bin/bash
 # Update the package list
 sudo apt update

 # Install Java (required for Jenkins)
 sudo apt install openjdk-17-jre-headless -y

 # Download Jenkins keyring
 sudo wget -O /usr/share/keyrings/jenkins-keyring.asc \
   https://pkg.jenkins.io/debian-stable/jenkins.io-2023.key

 # Add Jenkins repository to sources
 echo "deb [signed-by=/usr/share/keyrings/jenkins-keyring.asc] \
 https://pkg.jenkins.io/debian-stable binary/" | sudo tee \
 /etc/apt/sources.list.d/jenkins.list > /dev/null

 # Update the package list and install Jenkins
 sudo apt-get update
 sudo apt-get install jenkins -y
Save the script, make it executable, and run it:
 chmod +x jenkins.sh
 sudo ./jenkins.sh
Step 3: Install Docker on Jenkins Server
Use the existing Docker installation script (
doc.sh) to install Docker on the Jenkins server. If you don't have the script, you can follow these commands:sudo apt-get update sudo apt-get install ca-certificates curl -y sudo install -m 0755 -d /etc/apt/keyrings sudo curl -fsSL https://download.docker.com/linux/ubuntu/gpg -o /etc/apt/keyrings/docker.asc sudo chmod a+r /etc/apt/keyrings/docker.asc echo \ "deb [arch=$(dpkg --print-architecture) signed-by=/etc/apt/keyrings/docker.asc] https://download.docker.com/linux/ubuntu \ $(. /etc/os-release && echo "$VERSION_CODENAME") stable" | \ sudo tee /etc/apt/sources.list.d/docker.list > /dev/null sudo apt-get update sudo apt-get install docker-ce docker-ce-cli containerd.io docker-buildx-plugin docker-compose-plugin -yChange the Docker socket permissions:
sudo chmod 666 /var/run/docker.sockVerify Docker installation by checking the version:
docker --version
Step 4: Access Jenkins on Browser
Once Jenkins is installed, open your browser and go to:
http://<jenkins-server-ip>:8080Retrieve the Jenkins admin password:
sudo cat /var/lib/jenkins/secrets/initialAdminPasswordCopy the password and paste it into the Jenkins login screen.
Step 5: Install Suggested Plugins
After logging in for the first time, Jenkins will prompt you to install plugins. Choose the Install Suggested Plugins option.
Wait for Jenkins to install the plugins.
Step 6: Configure Jenkins and Start
After the plugins installation is complete, configure Jenkins by creating the admin user account and setting up other necessary configurations.
Start Jenkins, and it should be ready to use!
Phase II: Create a Private Git Repository and Push Source Code
Here’s how to create a private Git repository, push your source code, or fork an existing repository and clone it to your local environment.
Option 1: Create a Private Git Repository and Push Source Code
Step 1: Create a Private Repository
Log into your Git Hosting Service (e.g., GitHub, GitLab, Bitbucket).
Create a New Repository:
Click on New or Create Repository.
Set the repository name, description, and choose Private.
Click Create.
Step 2: Clone the Repository Locally
Open your terminal/command prompt.
Clone the Repository:
git clone https://<your-git-host>/<your-username>/<your-repo>.gitChange into the directory of the cloned repository:
cd <your-repo>
Step 3: Push Your Source Code
Copy Your Source Code into the cloned repository directory.
Stage the Changes:
git add .Commit the Changes:
git commit -m "Initial commit"Push to the Remote Repository:
git push origin main # or 'master' depending on your default branch
Option 2: Fork an Existing Repository
Step 1: Fork the Repository
Go to the repository you want to fork (on GitHub, GitLab, etc.).
Click the Fork button to create a copy of the repository under your account.
Step 2: Clone the Forked Repository Locally
Open your terminal/command prompt.
Clone the Forked Repository:
git clone https://<your-git-host>/<your-username>/<forked-repo>.gitChange into the directory of the cloned repository:
cd <forked-repo>
Step 3: Make Changes and Push to Your Fork
Make any necessary changes or corrections to the code in your local repository.
Stage the Changes:
git add .Commit the Changes:
git commit -m "Corrected typos and made improvements"Push to Your Fork:
git push origin main # or 'master' depending on your default branch
Phase III: Install Necessary Plugins in Jenkins

Click on install
Now let configure the plugins
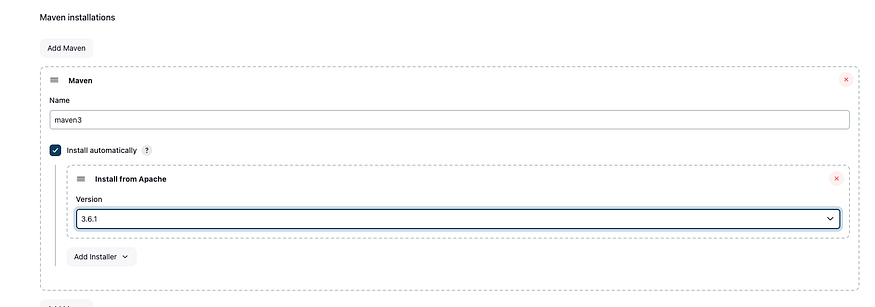
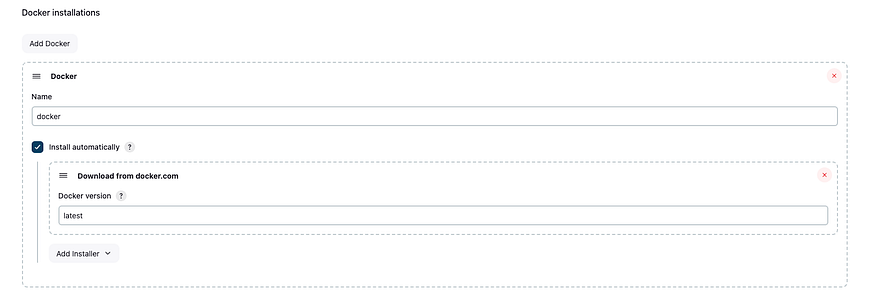
Go to manage Jenkins, Tools
JDK

Sonar Qube

Maven
Docker
Let configure Credentials, got manage Jenkins, credential, global, add credential
For Git
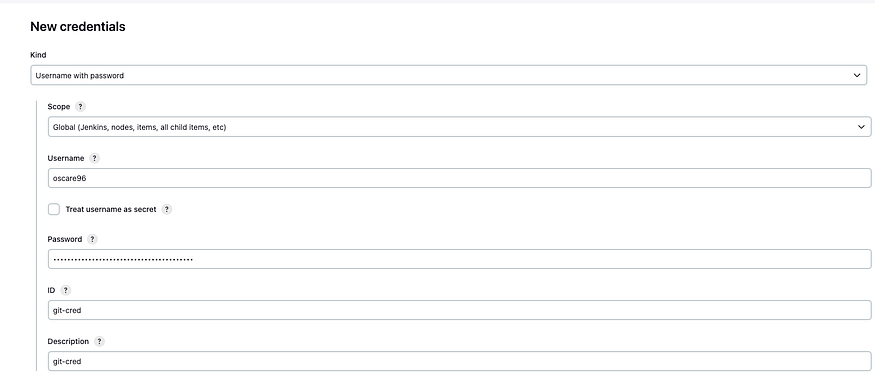
Put in your GitHub User name and the token we generated, click on create
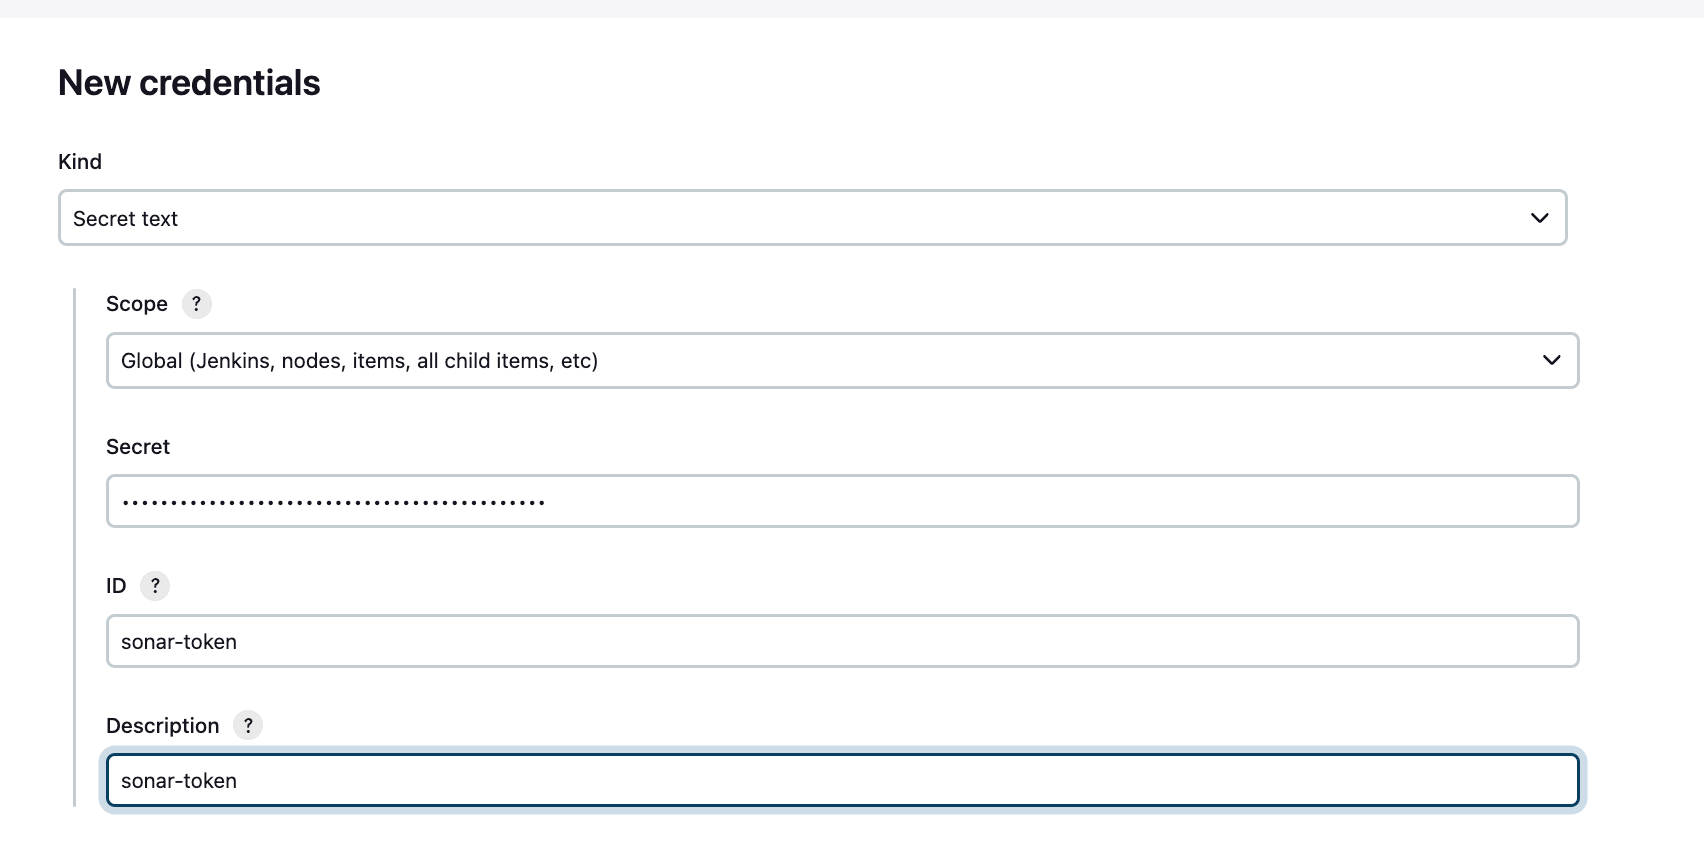
For SonarQube
We will need a token, Go to SQ on the browser, Administration, Security, Users


Copy the token and save it somewhere
Now let go credential, Global tools, add Credential
For Docker
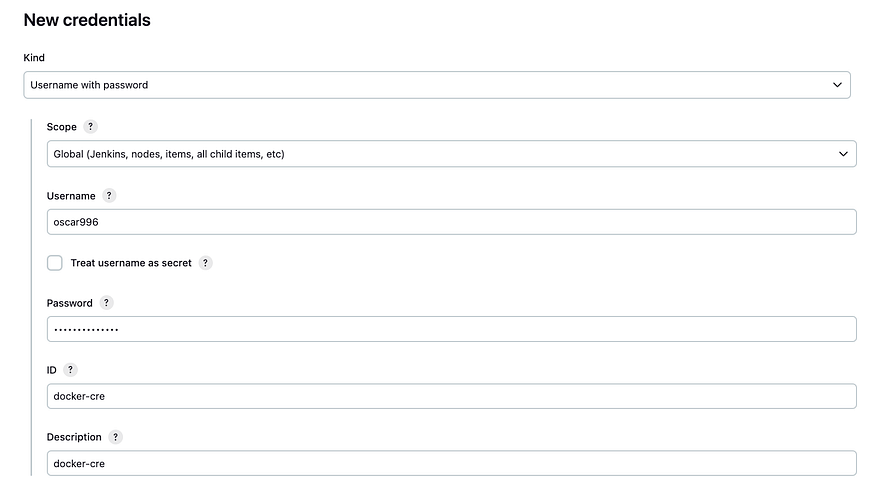
For Nexus
Go to manage jenkins, Managed files, Add a new Config, Global Maven settings.xml, and go down change the ID to “global-settings”

Click on Next
Go down to line 119 and copy from line 119–123 and past it at line 125
Copy

Past it twice, one for Release and the 2nd one for Snapshots
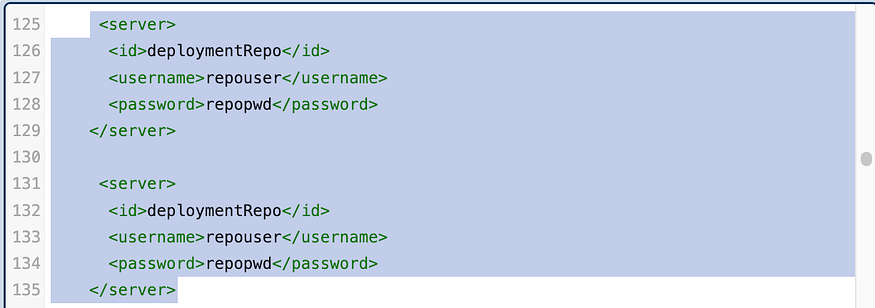
Configure both this way
<server>
      <id>maven-releases</id>
      <username>admin</username>
      <password>dev</password>
    </server>
    <server>
      <id>maven-snapshots</id>
      <username>admin</username>
      <password>dev</password>
    </server>
The password will be the password for you Nexus and click on Submit
Now let go and create the pipeline
Go to dashboard, click on New, give it a name, Select Pipeline

Go down and select Hallow world
Let start writing out pipeline
1st stage will be tools
 agent any
    tools{
        jdk 'jdk17'
        maven 'maven3'
    }
2nd stage will be git Checkout
stage('git Checkout') {
            steps {
               git branch: 'main', credentialsId: 'git-cred', url: 'https://github.com/Oscare96/BOARDGAME.git'
            }
        }
3rd stage will be Compile
stage('Compile') {
            steps {
                sh "mvn compile"
            }
        }
4th stage will be Test
stage('Test') {
            steps {
                sh 'mvn test'
            }
        }
5th stage File System Scan, we will be using Trivy for this so let first install trivy on the jenkins VM
vim trivy.sh
# Install necessary packages
sudo apt-get install wget apt-transport-https gnupg lsb-release -y

# Download and add the Trivy GPG key
wget -qO - https://aquasecurity.github.io/trivy-repo/deb/public.key | gpg --dearmor | sudo tee /usr/share/keyrings/trivy.gpg > /dev/null

# Add the Trivy repository
echo "deb [signed-by=/usr/share/keyrings/trivy.gpg] https://aquasecurity.github.io/trivy-repo/deb $(lsb_release -cs) main" | sudo tee -a /etc/apt/sources.list.d/trivy.list

# Update the package list
sudo apt-get update

# Install Trivy
sudo apt-get install trivy -y
chmod +x trivy.sh
./trivy.sh
stage('File System scan') {
            steps {
                sh "trivy fs --format table -o trivy-fs-report.html ."
            }
        }
6th Stage SonarQube Analysis
Before we write the pipeline let 1st configure SQ
Go to dashboard, Manage, System, Look for SQ Installation

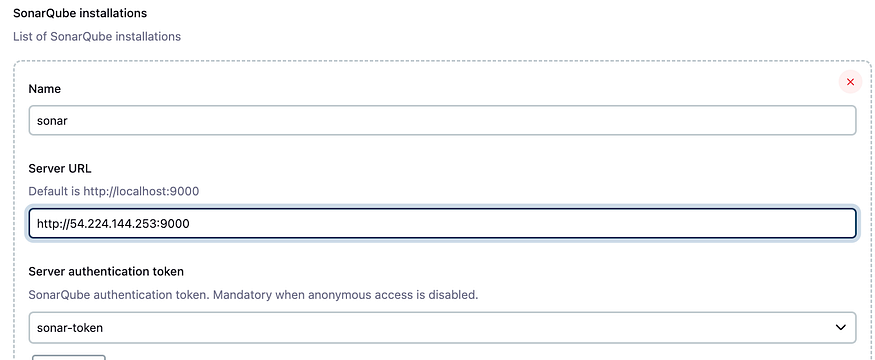
Let go and write our pipeline
Click on pipeline syntex
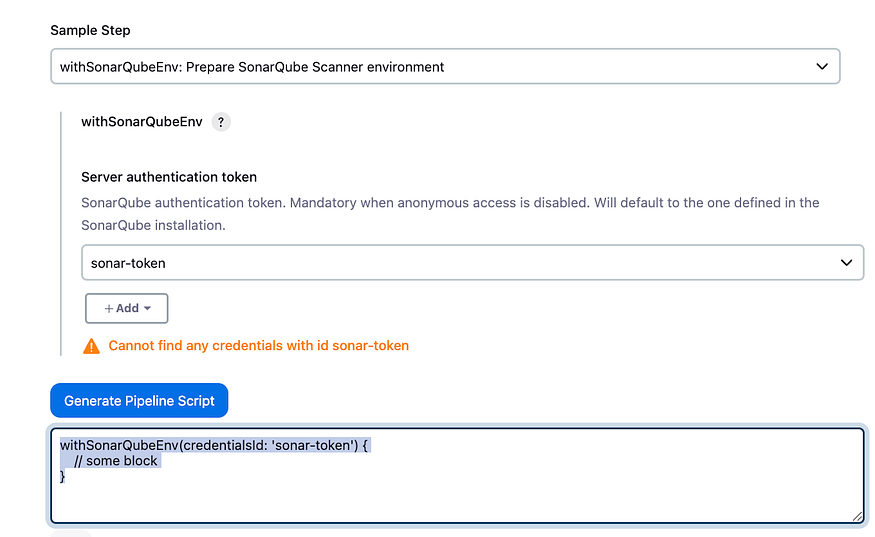
We will need to define the tool
environment {
        scanner_HOME= tool 'sonar-scanner'
    }
stage('SonarQube Analysis') {
            steps {
                withSonarQubeEnv('sonar') {
                    sh '''
                    $SCANNER_HOME/bin/sonar-scanner \
                    -Dsonar.projectName=BoardGMAE \
                    -Dsonar.projectKey=BoardGmae \
                    -Dsonar.java.binaries=.
                    '''
                }
            }
        }
7th Stage is Quality Gate
Let go back to SQ webpage, Click on Administration, Configuration, Webhooks, create,
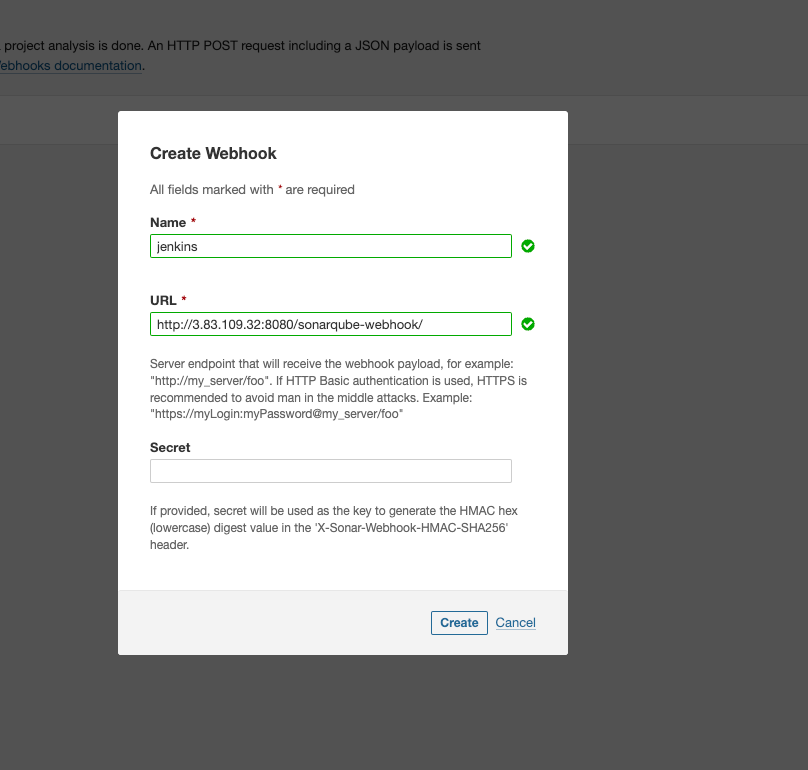
For the URL we used Jenkins IP
stage('Quality Gate') {
            steps {
                script {
                    waitForQualityGate abortPipeline: false, credentialsId: 'sonar-token'
                }
            }
        }
8th Build
stage('Build') {
            steps {
                sh "mvn package"
            }
        }
9th stage: Publish To Nexus
Go into Nexus and click on Browns, maven-releases and copy the URL
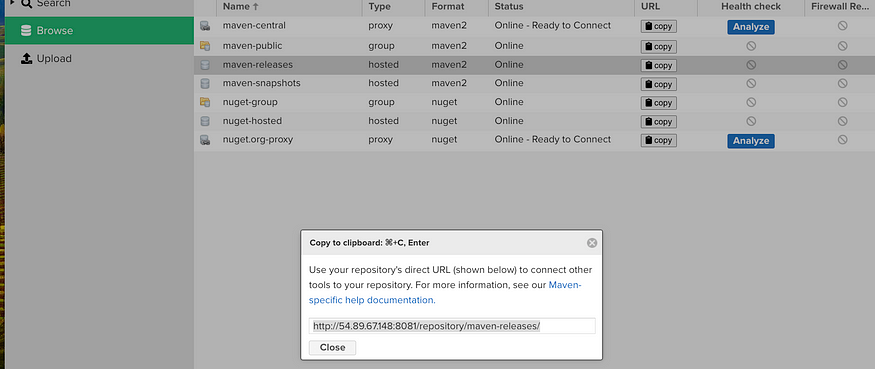
We will need to configure our Pom file
Go to into Github, and into pom.xml, click on edit, all the way down look for maven-releases and replace the maven-releases URL

Go back to Nexus and copy maven-snapshots URL and replace it in the pom file

Click on commit change
Let click on pipeline syntax
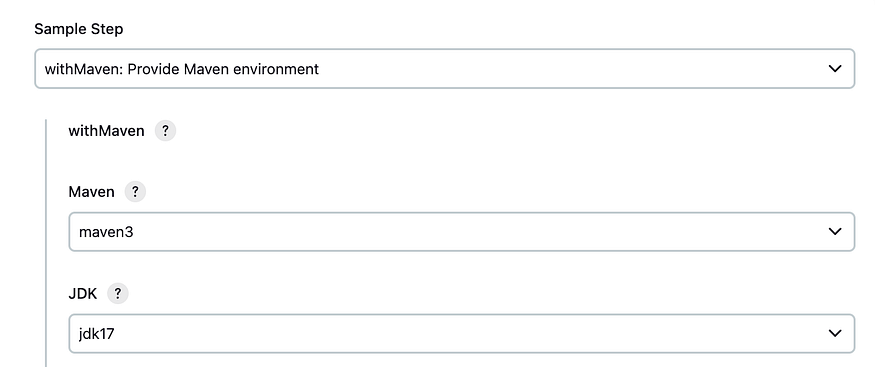

Click on generate

stage('Publish To Nexus') {
            steps {
               withMaven(globalMavenSettingsConfig: 'global-settings', jdk: 'jdk17', maven: 'maven3', mavenSettingsConfig: '', traceability: true) {
                    sh "mvn deploy"
                }
            }
        }
10th Build and Tag Docker Image
Go to Syntax
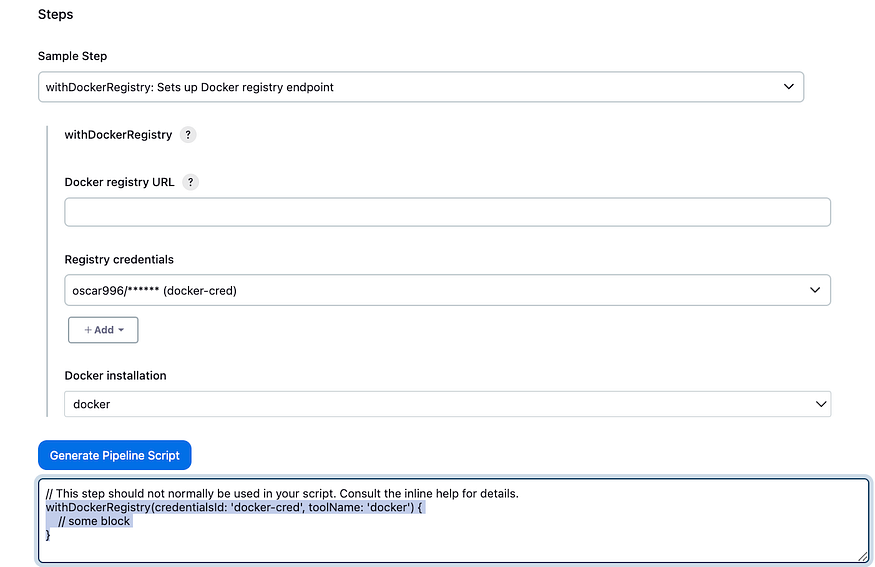
stage('Build and Tag Docker Image') {
            steps {
                script {
                    withDockerRegistry(credentialsId: 'docker-cred', toolName: 'docker') {
                          sh "docker build -t oscar996/boardshack:latest ."
                    }
                }
            }
        }
11th Scan Docker Image Using Trivy
stage('Docker Image Scan') {
            steps {
                sh "trivy image --format table -o trivy-fs-report.html oscar996/boardshack:latest "
            }
        }
12 th Push Docker Image
stage('Push Docker Image') {
            steps {
                script {
                    withDockerRegistry(credentialsId: 'docker-cred', toolName: 'docker') {
                          sh "docker push oscar996/boardshack:latest"
                    }
                }
            }
        }
13th Let deploy the application to K8s
Let create our service account = User
vi svc.yml
apiVersion: v1
kind: ServiceAccount
metadata:
  name: jenkins
  namespace: webapps
kubectl create ns webapps
kubectl apply -f svc.yml

Let role that will give permission to user
vi role.yaml
apiVersion: rbac.authorization.k8s.io/v1
kind: ClusterRole
metadata:
  name: full-access-clusterrole
rules:
- apiGroups: ["*"]        # Allow access to all API groups
  resources: ["*"]        # Allow access to all resources
  verbs: ["*"]            # Allow all actions (get, list, create, update, delete, etc.)
kubectl apply -f role.yaml

Now let assign the role to the service account
Bind the role to service Account and add a token to it
vi bind.yml
apiVersion: rbac.authorization.k8s.io/v1
kind: ClusterRoleBinding
metadata:
  name: full-access-clusterrolebinding
subjects:
- kind: ServiceAccount
  name: jenkins
  namespace: webapps   # Replace with your service account's namespace
roleRef:
  apiGroup: rbac.authorization.k8s.io
  kind: ClusterRole
  name: full-access-clusterrole  # The name of the ClusterRole created above
kubectl apply -f bind.yml

Let create API Token
vi secret.yml
apiVersion: v1
kind: Secret
type: kubernetes.io/service-account-token
metadata:
  name: mysecretname
  namespace: webapps
  annotations:
    kubernetes.io/service-account.name: jenkins
kubectl apply -f secret.yml
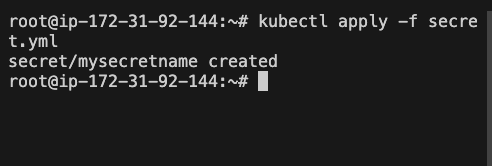
Let now try to connect jenkins to kubernetes, we will need to get the k8s token
kubectl describe secret mysecretname -n webapps
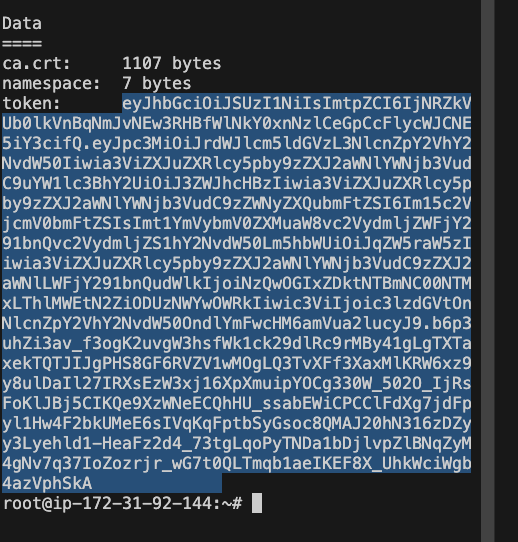
Copy the token
Let go back to Jenkins, credential, global, ad cred, choose secret text, past the token in secret and create
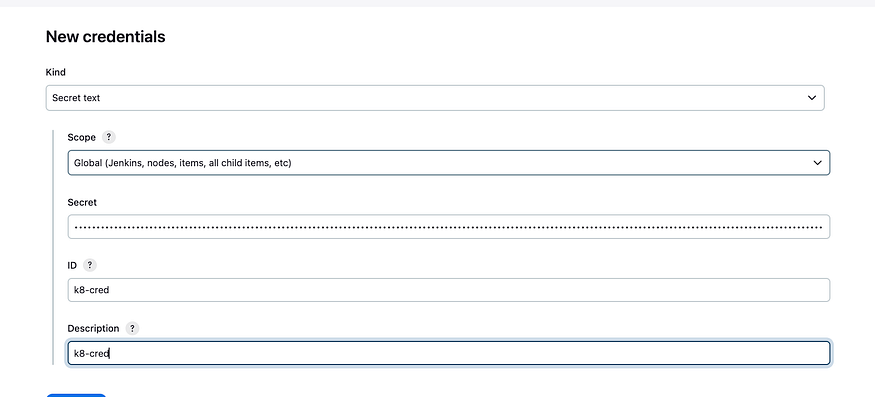
Go to Git and change the image in deployment-service.ymal

Copy you image from the pipeline and replace, Click on Commit changes
Let now install kubectl on Jenkins
Run this command on the Jenkins Server
vi k8sctl.sh
# Download kubectl from the specified URL
curl -o kubectl https://amazon-eks.s3.us-west-2.amazonaws.com/1.19.6/2021-01-05/bin/linux/amd64/kubectl

# Make the kubectl binary executable
chmod +x ./kubectl

# Move the kubectl binary to /usr/local/bin so it's accessible system-wide
sudo mv ./kubectl /usr/local/bin

# Verify the kubectl installation by checking its version
kubectl version --short --client
chmod +x k8sctl.sh
./k8sctl.sh

Let go get out server endpoint on the master node, we will need it in syntax
cd ~/.kube
ls
cat config
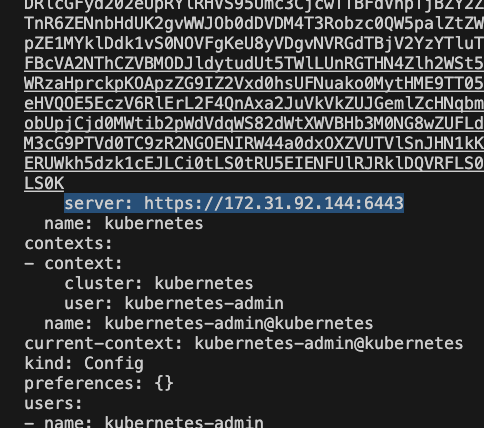
Copy the server URL
Back to the pipeline, click on syntax
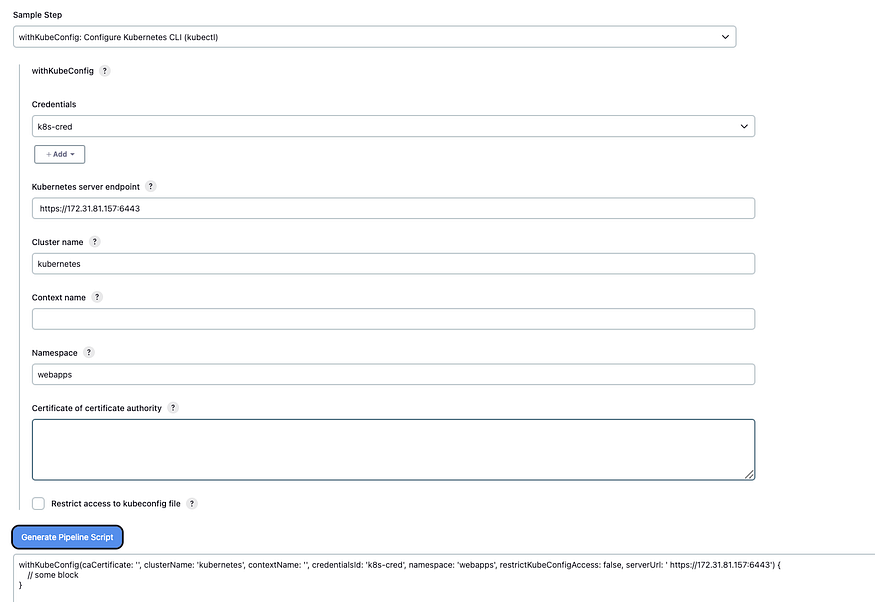
Past the server URL in server endpoint and configure the rest just like i did
click one generate and copy the code
Back to the pipeline : Deploy To Kubernetes
stage('Deploy to k8s') {
            steps {
                withKubeConfig(caCertificate: '', clusterName: 'kubernetes', contextName: '', credentialsId: 'k8-cred', namespace: 'webapps', restrictKubeConfigAccess: false, serverUrl: 'https://172.31.92.144:6443') {
                    sh "kubectl -f deployment-service.yml"
                }
            }
        }
Let run another command that will check our pods and service
14th Verify the deployment
stage('Verify the Deployment') {
            steps {
                withKubeConfig(caCertificate: '', clusterName: 'kubernetes', contextName: '', credentialsId: 'k8-cred', namespace: 'webapps', restrictKubeConfigAccess: false, serverUrl: 'https://172.31.92.144:6443') {
                    sh "kubectl get pods"
            }
        }
   }
Now let configure our Mail Notification
Go to you Gmail Account, Manage Account, Security, 2-Step Verification, It will ask you your password, in the search bar type App passwords
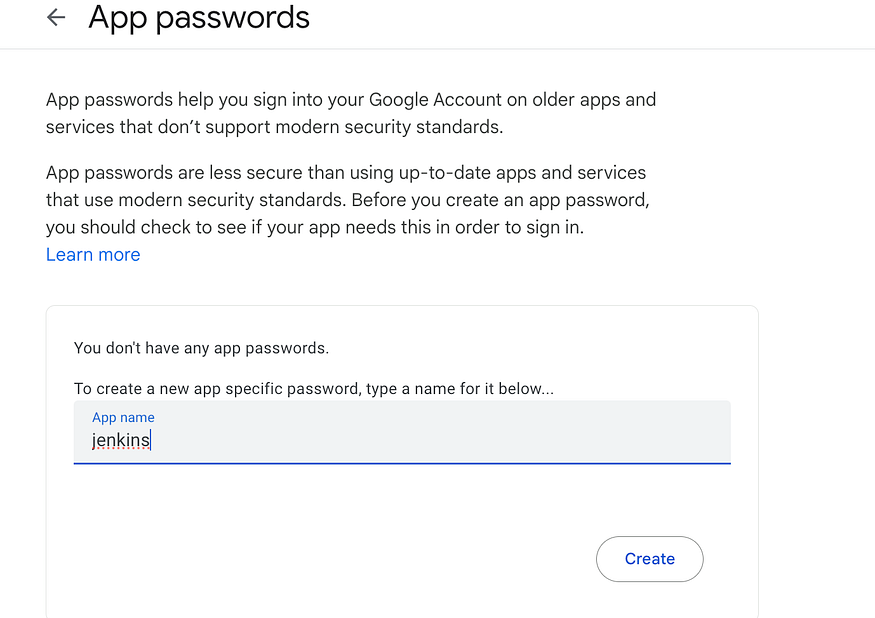
Create , you will see a code copy it
Let go back to jenkins make sure your pipeline is save
Go to dashboard, manage jenkins, system, scrow down to Extended E-mail Notification

Click on advance, +Add and create a credential,
The password will be the password we just generated
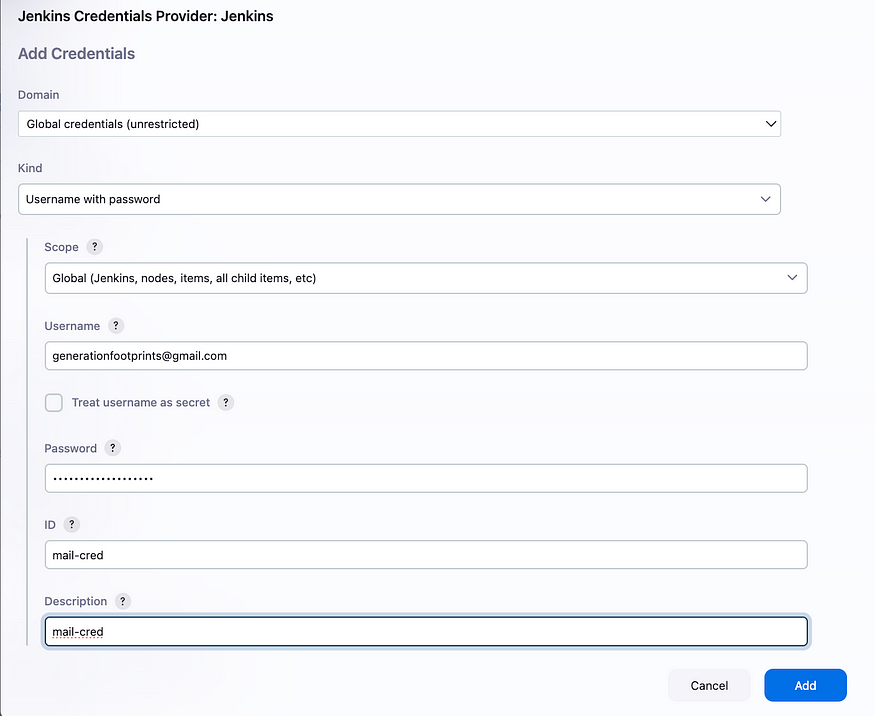
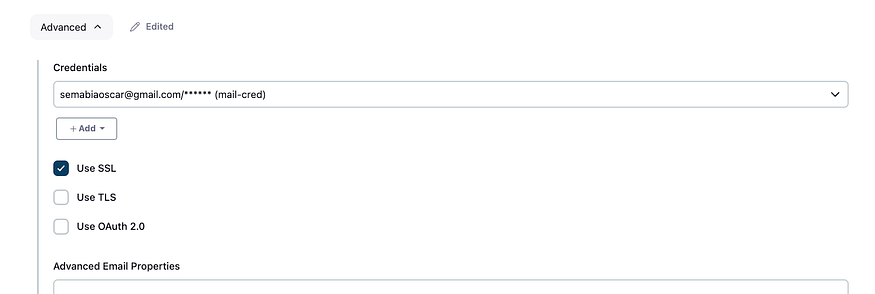
Scroll down to E-mail Notification

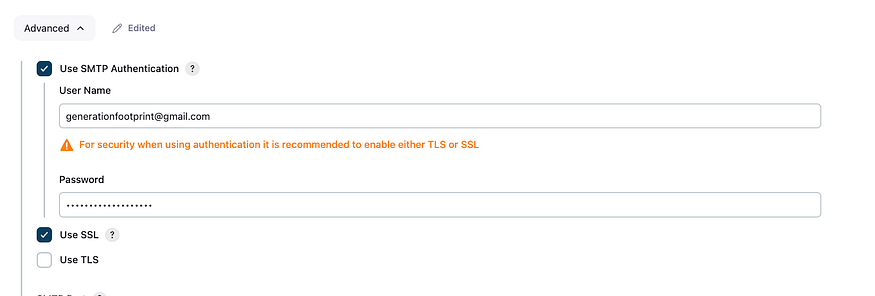

Let test our configuration
Put your email in the test configuration box and click on Test configuration on the right

Check you email you should receive an email
This will be the pipeline for that stage
post {
        always {
            script {
                def jobName = env.JOB_NAME
                def buildNumber = env.BUILD_NUMBER
                def pipelineStatus = currentBuild.result ?: 'UNKNOWN'
                def bannerColor = pipelineStatus.toUpperCase() == 'SUCCESS' ? 'green' : 'red'

                def body = """
                <html>
                <body>
                    <div style="border: 4px solid ${bannerColor}; padding: 10px;">
                        <h2>${jobName} - Build ${buildNumber}</h2>
                        <div style="background-color: ${bannerColor}; padding: 10px;">
                            <h3 style="color: white;">Pipeline Status: ${pipelineStatus.toUpperCase()}</h3>
                        </div>
                        <p>Check the <a href="${env.BUILD_URL}">console output</a>.</p>
                    </div>
                </body>
                </html>
                """

                emailext (
                    subject: "${jobName} - Build ${buildNumber} - ${pipelineStatus.toUpperCase()}",
                    body: body,
                    to: 'recipient-email@gmail.com',
                    from: 'generationfootprints3@gmail.com',
                    replyTo: 'jenkins@example.com',
                    mimeType: 'text/html',
                    attachmentsPattern: 'trivy-image-report.html'
                )
            }
        }
The only thing you will have to do here is to change the email to your email, where it says “generationfootprints3@gmail.com”
Let try to run our pipeline
pipeline {
    agent any
    tools {
        jdk 'jdk17'
        maven 'maven3'
    }
    environment {
        SCANNER_HOME = tool 'sonar-scanner'
    }

    stages {
        stage('Git Checkout') {
            steps {
                git branch: 'main', credentialsId: 'git-cred', url: 'https://github.com/Oscare96/BOARDGAME.git'
            }
        }

        stage('Compile') {
            steps {
                sh "mvn compile"
            }
        }

        stage('Test') {
            steps {
                sh "mvn test"
            }
        }

        stage('File System Scan') {
            steps {
                sh "trivy fs --format table -o trivy-fs-report.html ."
            }
        }

        stage('SonarQube Analysis') {
            steps {
                withSonarQubeEnv('sonar') {
                    sh """
                    $SCANNER_HOME/bin/sonar-scanner \
                    -Dsonar.projectName=BoardGMAE \
                    -Dsonar.projectKey=BoardGmae \
                    -Dsonar.java.binaries=.
                    """
                }
            }
        }

        stage('Quality Gate') {
            steps {
                script {
                    waitForQualityGate abortPipeline: false, credentialsId: 'sonar-token'
                }
            }
        }

        stage('Build') {
            steps {
                sh "mvn package"
            }
        }

        stage('Publish to Nexus') {
            steps {
                withMaven(globalMavenSettingsConfig: 'global-settings', jdk: 'jdk17', maven: 'maven3', mavenSettingsConfig: '', traceability: true) {
                    sh "mvn deploy"
                }
            }
        }

        stage('Build and Tag Docker Image') {
            steps {
                script {
                    withDockerRegistry(credentialsId: 'docker-cred', toolName: 'docker') {
                        sh "docker build -t oscar996/boardshack:latest ."
                    }
                }
            }
        }

        stage('Docker Image Scan') {
            steps {
                sh "trivy image --format table -o trivy-image-report.html oscar996/boardshack:latest"
            }
        }

        stage('Push Docker Image') {
            steps {
                script {
                    withDockerRegistry(credentialsId: 'docker-cred', toolName: 'docker') {
                        sh "docker push oscar996/boardshack:latest"
                    }
                }
            }
        }

        stage('Deploy to K8s') {
            steps {
                withKubeConfig(caCertificate: '', clusterName: 'kubernetes', contextName: '', credentialsId: 'k8-cred', namespace: 'webapps', restrictKubeConfigAccess: false, serverUrl: 'https://172.31.92.144:6443') {
                    sh "kubectl apply -f deployment-service.yaml"
                }
            }
        }

        stage('Verify the Deployment') {
            steps {
                withKubeConfig(caCertificate: '', clusterName: 'kubernetes', contextName: '', credentialsId: 'k8-cred', namespace: 'webapps', restrictKubeConfigAccess: false, serverUrl: 'https://172.31.92.144:6443') {
                    sh "kubectl get pods -n webapps"
                    sh "kubectl get svc -n webapps"
                }
            }
        }
    }

    post {
        always {
            script {
                def jobName = env.JOB_NAME
                def buildNumber = env.BUILD_NUMBER
                def pipelineStatus = currentBuild.result ?: 'UNKNOWN'
                def bannerColor = pipelineStatus.toUpperCase() == 'SUCCESS' ? 'green' : 'red'

                def body = """
                <html>
                <body>
                    <div style="border: 4px solid ${bannerColor}; padding: 10px;">
                        <h2>${jobName} - Build ${buildNumber}</h2>
                        <div style="background-color: ${bannerColor}; padding: 10px;">
                            <h3 style="color: white;">Pipeline Status: ${pipelineStatus.toUpperCase()}</h3>
                        </div>
                        <p>Check the <a href="${env.BUILD_URL}">console output</a>.</p>
                    </div>
                </body>
                </html>
                """

                emailext (
                    subject: "${jobName} - Build ${buildNumber} - ${pipelineStatus.toUpperCase()}",
                    body: body,
                    to: 'recipient-email@gmail.com',
                    from: 'semabiaoscar@gmail.com',
                    replyTo: 'jenkins@example.com',
                    mimeType: 'text/html',
                    attachmentsPattern: 'trivy-image-report.html'
                )
            }
        }
    }
}

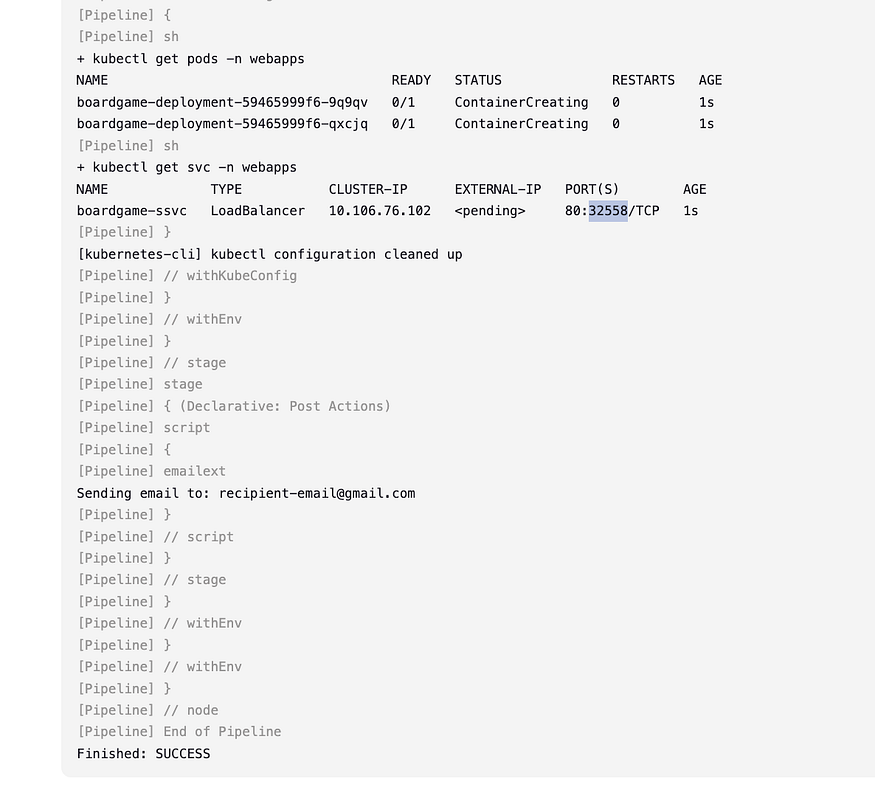
So the port that we can use to access our application is 32558 yours may be different. So copy the node 1 IP:32558
Let go to Nexus, Browse, Maven-releases,
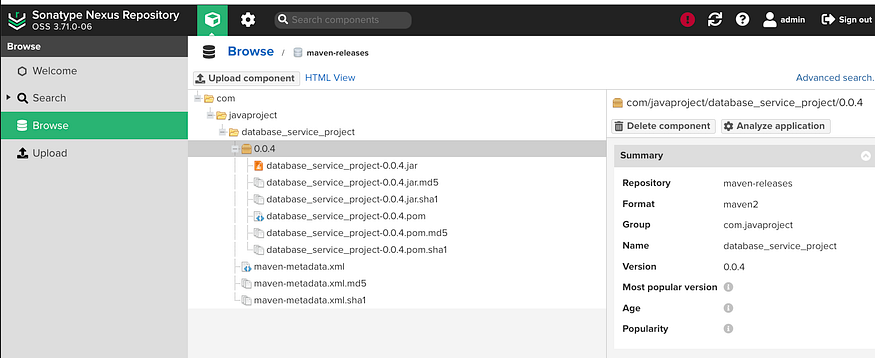
SonarQube, Projects

Our Pipeline is working fine, Now let go and create our monitoring servers
Let create a VM called Monitoring
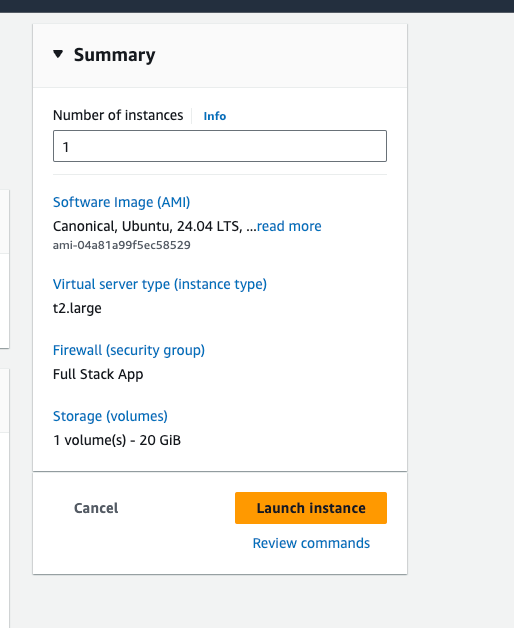
SSH into the server
Let 1st install Prometheus
apt update
sudo apt update
# Let download the package
wget https://github.com/prometheus/prometheus/releases/download/v2.51.0-rc.0/prometheus-2.51.0-rc.0.linux-amd64.tar.gz
tar -xvf prometheus-2.51.0-rc.0.linux-amd64.tar.gz
rm -rf prometheus-2.51.0-rc.0.linux-amd64.tar.gz
cd prometheus-2.51.0-rc.0.linux-amd64
ls
Let try to run Prometheus &= is used to run as non interactively
./prometheus &
It’s running in the background on port 9090
Copy the IP:9090 and access in the browser
Now let install Grafana
sudo apt-get install -y adduser libfontconfig1 musl
wget https://dl.grafana.com/enterprise/release/grafana-enterprise_11.1.4_amd64.deb
sudo dpkg -i grafana-enterprise_11.1.4_amd64.deb
sudo /bin/systemctl start grafana-server
Copy the Monitoring IP:3000
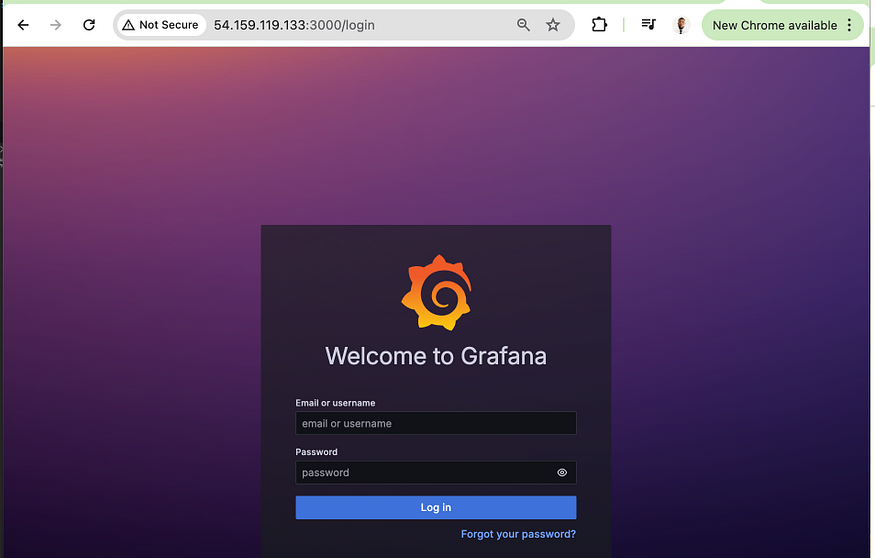
Default User name and Password is “admin”
And change it
Now let download Blackbox that will help us with the monitoring
wget https://github.com/prometheus/blackbox_exporter/releases/download/v0.24.0/blackbox_exporter-0.24.0.linux-amd64.tar.gz
tar -xvf blackbox_exporter-0.24.0.linux-amd64.tar.gz
rm -rf blackbox_exporter-0.24.0.linux-amd64.tar.gz
 ls
 cd blackbox_exporter-0.24.0.linux-amd64
ls
./blackbox_exporter &
It will be running on IP:9115
We will be adding a code to Prometheus.yaml file
cd ..
cd prometheus-2.51.0-rc.0.linux-amd64
ls
vi prometheus.yml
  - job_name: 'blackbox'
    metrics_path: /probe
    params:
      module: [http_2xx]  # Look for a HTTP 200 response.
    static_configs:
      - targets:
          - http://prometheus.io        # Target to probe with http.
          - https://prometheus.io       # Target to probe with https.
          - http://example.com:8080     # Target to probe with http on port 8080.
    relabel_configs:
      - source_labels: [_address_]
        target_label: _param_target
      - source_labels: [_param_target]
        target_label: instance
      - target_label: _address_
        replacement: 127.0.0.1:9115  # The blackbox exporter's real hostname:port.
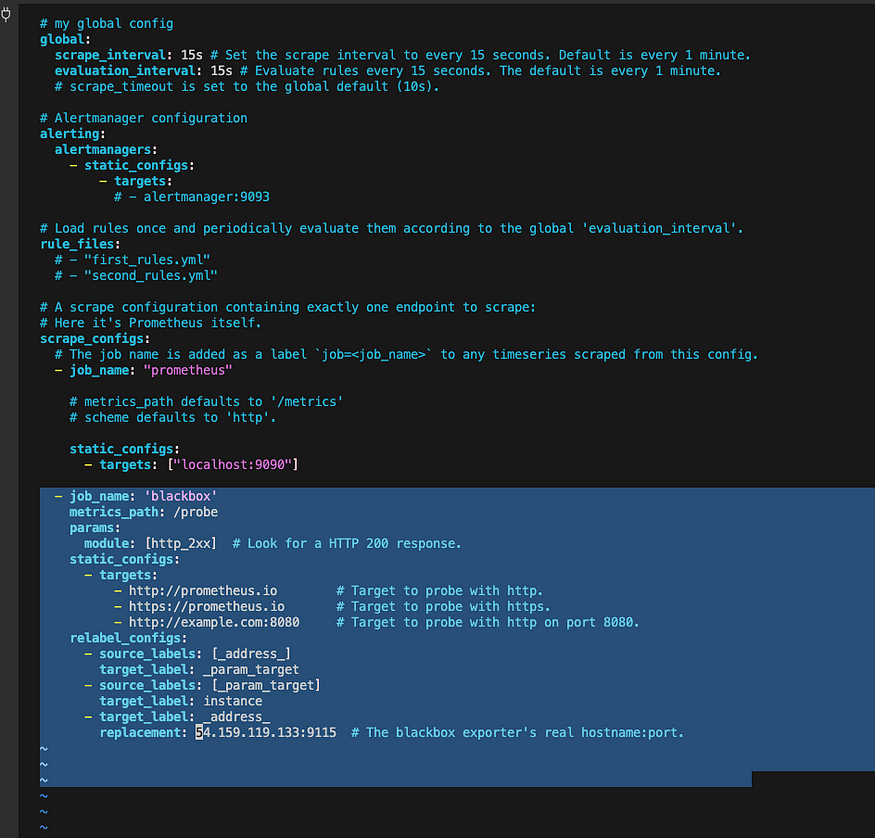
Make sure to chamge the IP Address with you monitoring IP

And also delect Prometheus.io and examplecom:8080 and replace it with your Deploy application URL
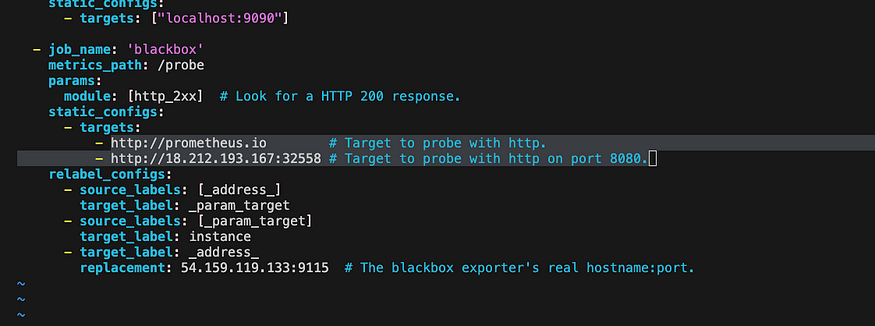
Which means you want to monitor Prometheus.io and your Application
This is how it should look like
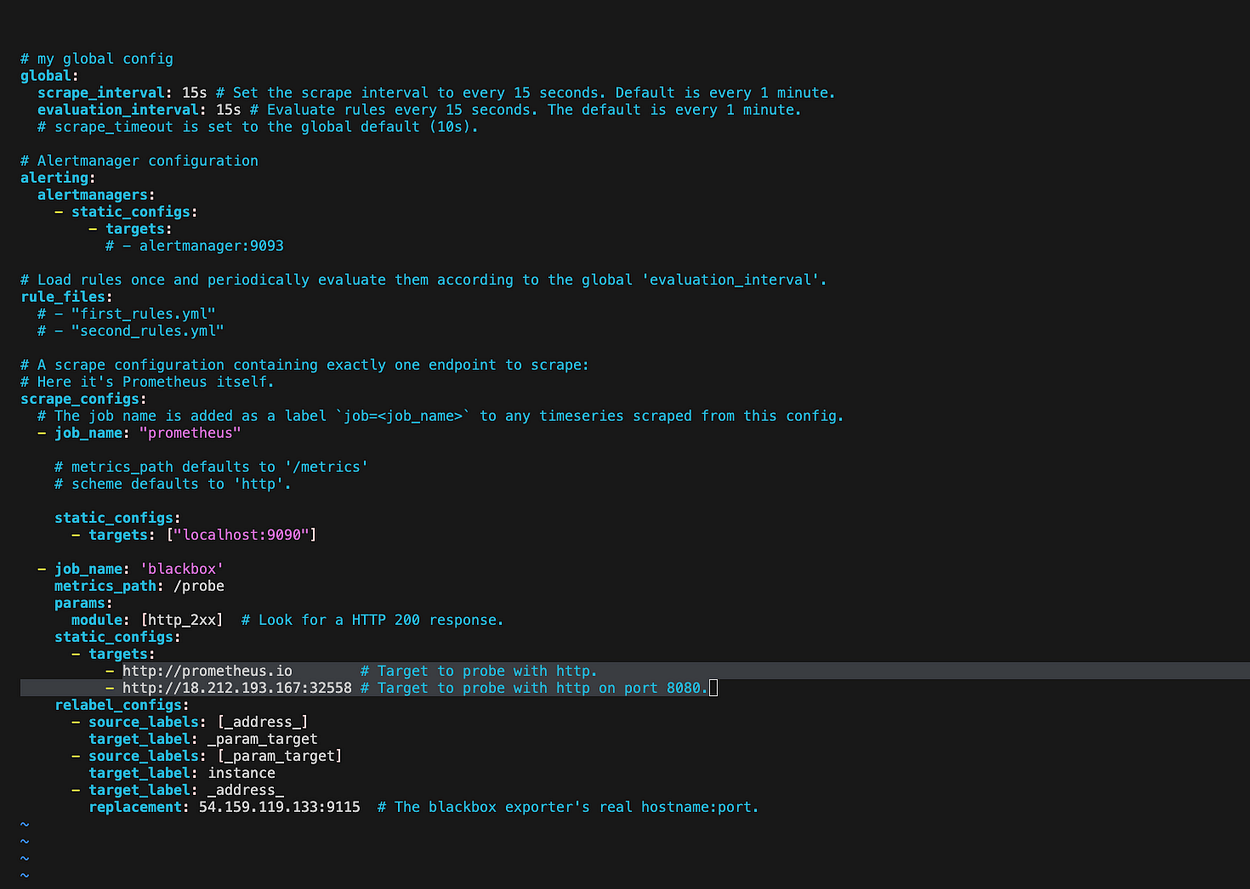
Save
Let restart Prometheus
pgrep prometheus

You will see an ID, Let kill that ID
kill"idnumber"
# Start Prometheus
./prometheus &
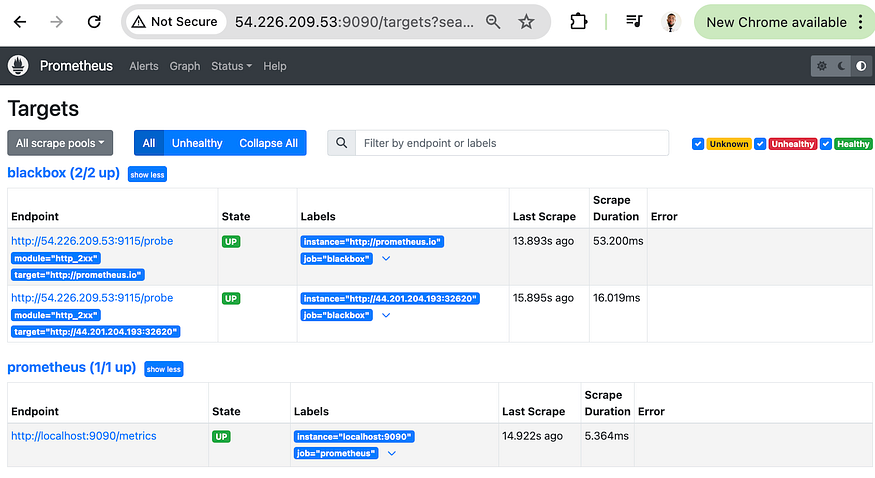
Refresh the Prometheus page, Status, Targets
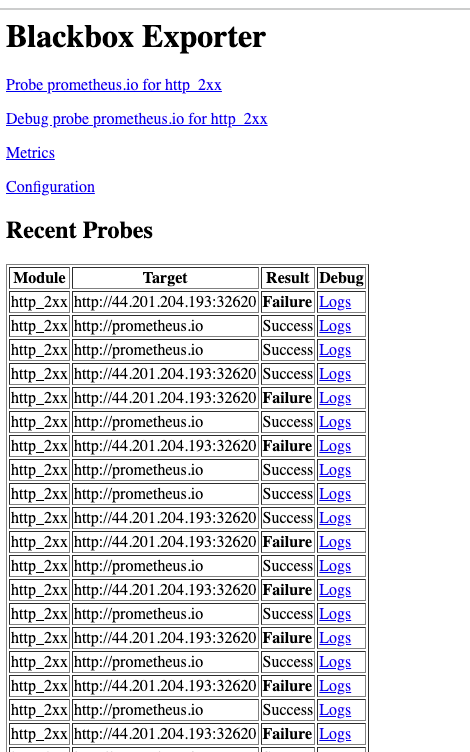
Refresh Blackbox page
Now let add Prometheus as data source inside Grafana
Go to Grafana, Click on data Source, Select Prometheus and copy the URL of Prometheus and past it
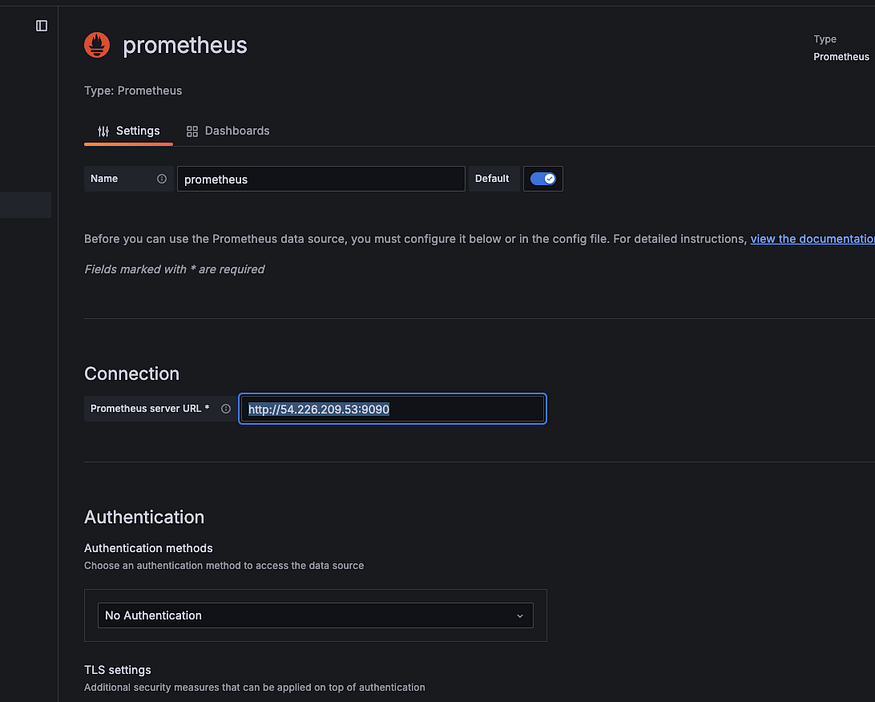
Scrow down and save
Click on import dashboard

Past the number 7587 in the load
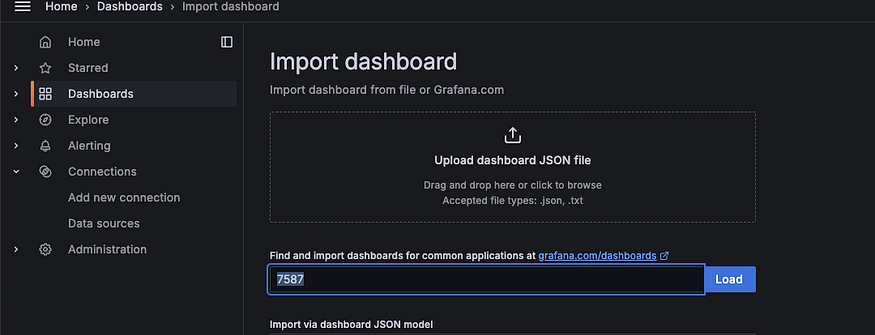
Click on load
Scrow down at signci-prometheus select Prometheus

And click on Import
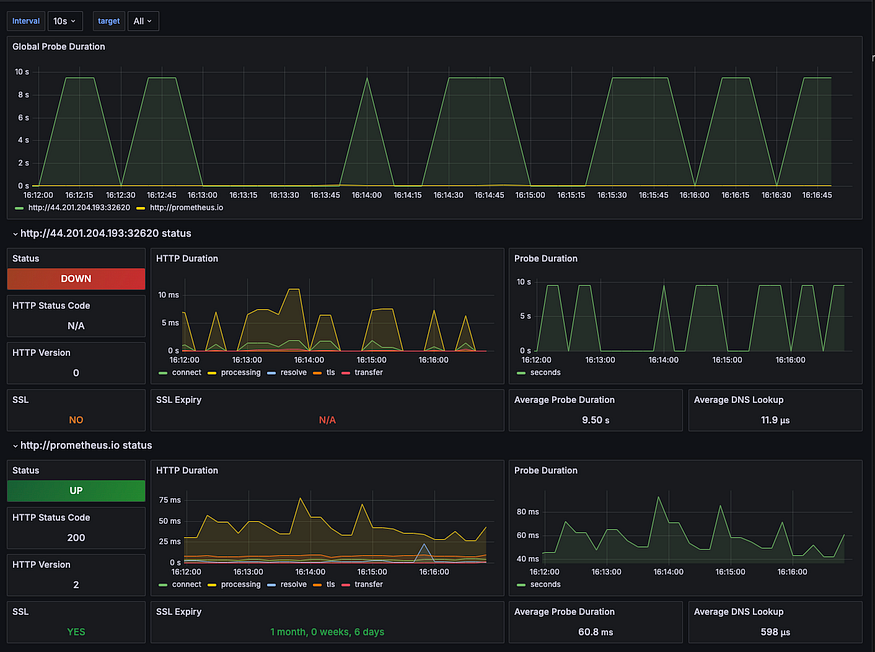
This is how we monitor our application, as you can one server is down
Now let try to monitor jenkins
Let first install a plugin

Install it and restart Jenkins
here how you can restart Jenkins by ip:port /restart
Go to the Jenkins Server and let download the node-exporter for Prometheus
wget https://github.com/prometheus/node_exporter/releases/download/v1.7.0/node_exporter-1.7.0.linux-amd64.tar.gz
tar -xvf node_exporter-1.7.0.linux-amd64.tar.gz
rm -rf node_exporter-1.7.0.linux-amd64.tar.gz
cd  node_exporter-1.7.0.linux-amd64
ls

./node_exporter &
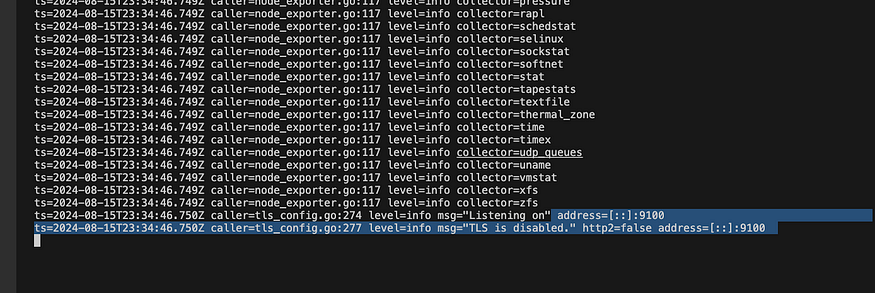
As you can see it is running on port 9100
Copy the Jenkins server IP:9100

Let go to the Monitoring Server, Make sure you are into Prometheus folder
You don’t need to run the command if you are in already
cd prometheus-2.51.0-rc.0.linux-amd64
ls
vi  prometheus.yml
Let edit it , Let add new job
 - job_name: 'node_exporter'
static_configs:
  - targets: ['localhost:9100']

 - job_name: 'jenkins'
metrics_path: '/prometheus'
static_configs:
  - targets: ['<your-jenkins-ip>:<your-jenkins-port>']
Change the 2 target, replace localhost with jenkins IP and the 2nd target with jenkins IP and port

pgrep prometheus

 kill "#"

./prometheus &
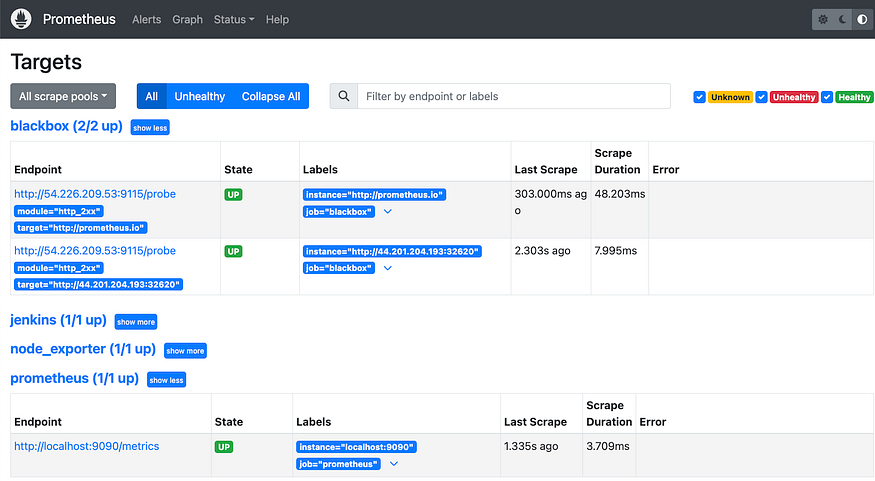
As you can see everything is up and running
Let now try to monitor node_exporter dashboard through grafana
Go to grafana, click on Import and in the load put this number 1860
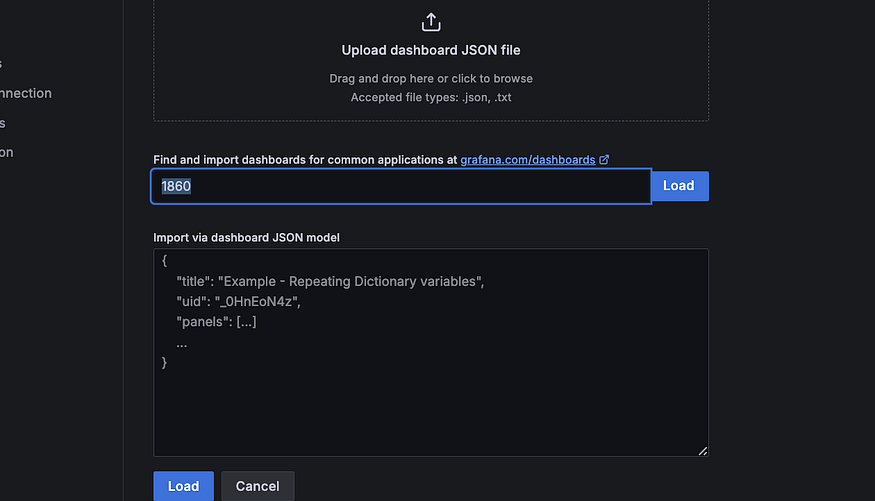
Click on load , Select Prometheus, and Import
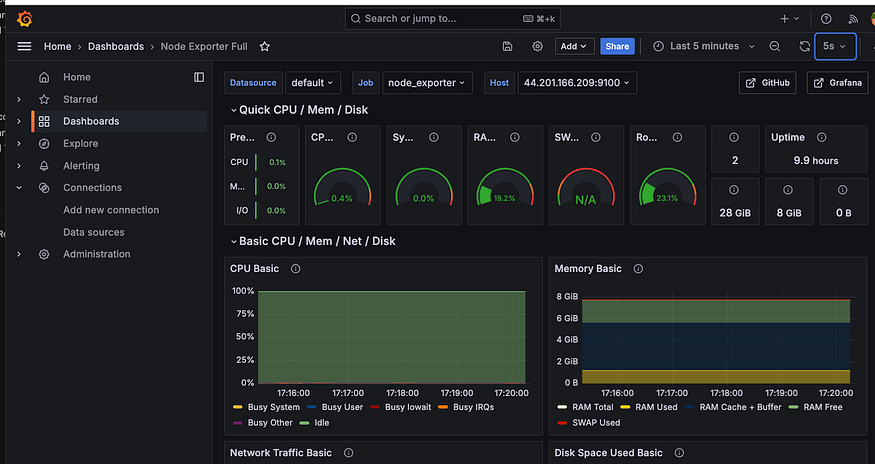
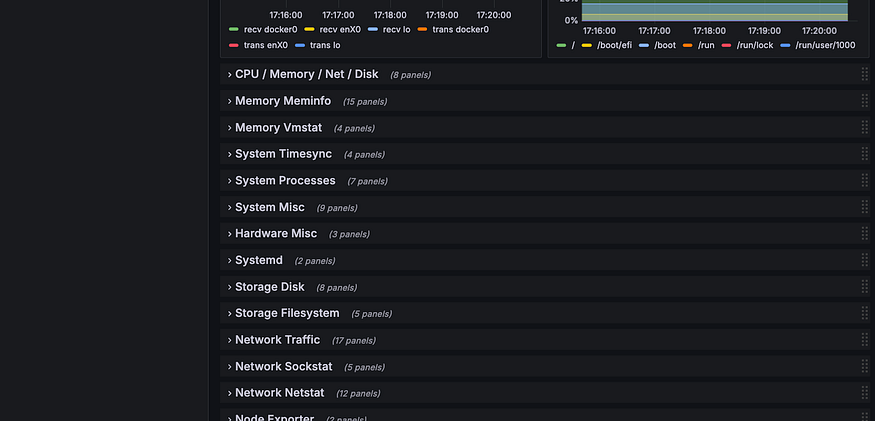
As you can see we can monitor everything here
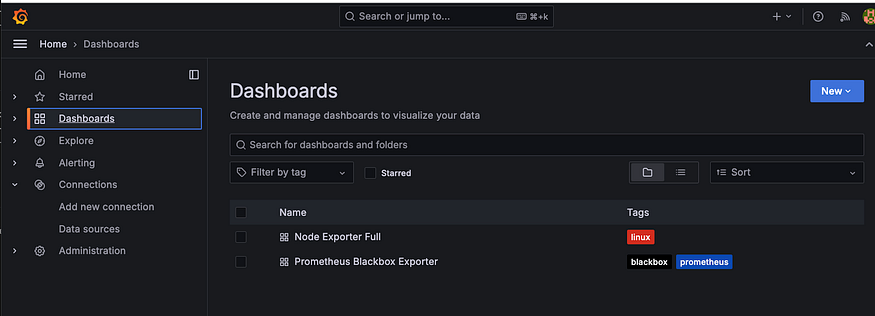
If you click on Dashboard, you can see that we have 2 dashboard
One monitoring jenkins system and the second one monitoring our website
Conclusion
Successfully completing this project will demonstrate the effectiveness of our DevOps practices, ensuring that the application is deployed both efficiently and securely. By fostering collaboration among developers, DevOps engineers, and QA teams, we can optimize our workflows, reduce time-to-market, and uphold high standards for our software. This initiative is a crucial step in refining our deployment strategies and reaffirms our commitment to delivering reliable, high-performing applications to our users.
Here is the video ref: https://youtu.be/NnkUGzaqqOc?si=fvBF928PTF1_cr1I
